library(miRminer)
library(tidygraph)
#>
#> Attaching package: 'tidygraph'
#> The following object is masked from 'package:stats':
#>
#>     filter
library(stringr)
library(ggraph)
#> Carregando pacotes exigidos: ggplot2
Let’s get the miRNA-target network for Coronary Artery disease and make it a tidy graph. Let’s also extract the out centrality degree of each node, and specify when a node is a miRNA or a gene.
cad_tab <- get_hmdd_net("Coronary Artery Disease")
#> Processing the request...

cad_graph <- as_tbl_graph(cad_tab, directed = TRUE) %>%
  mutate(
    out_centr = centrality_degree(mode = "out"),
    type = ifelse(str_detect(pattern = "hsa", name), "miRNA", "Gene")
  )
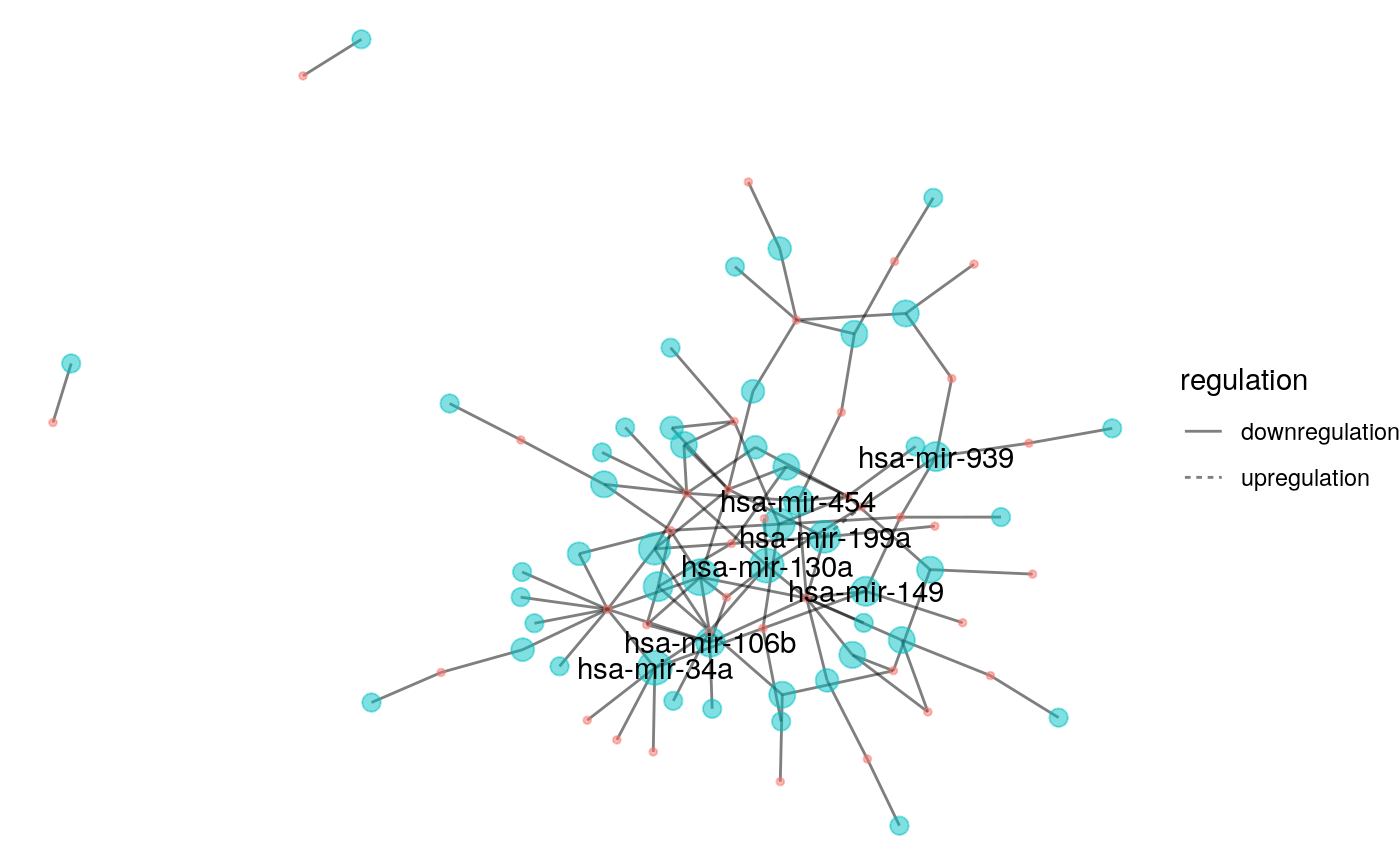
Now let’s plot it, emphasizing the largest centralities!
cad_graph %>%
  ggraph(layout = "kk") +
  geom_edge_fan(aes(linetype = regulation), alpha = 0.5) +
  geom_node_point(aes(size = out_centr, color = type),
                  alpha = 0.5, show.legend = FALSE) +
  geom_node_text(aes(label = ifelse((out_centr >= 4), name, NA)),
                 check_overlap = TRUE) +
  theme_void()
#> Warning: Removed 75 rows containing missing values (geom_text).